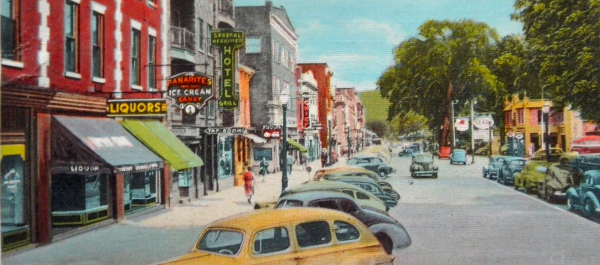
Main Street looking south. Circa 1940.
Herkimer is GROWING! Click here to visit another Herkimer informational website!
Area Summary
Herkimer Population - Overview
| Race | City | State | USA |
|---|---|---|---|
| White | 91.5%
7,088 people |
65.7%
12,740,974 people |
72.4%
223,553,265 people |
| Black or African American | 4.5%
345 people |
15.9%
3,073,800 people |
12.6%
38,929,319 people |
| Hispanic | 3.3%
259 people |
17.6%
3,416,922 people |
16.3%
50,477,594 people |
| Two or more races | 1.6%
121 people |
3.0%
585,849 people |
2.9%
9,009,073 people |
| Asian | 1.1%
89 people |
7.3%
1,420,244 people |
4.8%
14,674,252 people |
| American Indian and Alaska Native | 0.3%
25 people |
0.6%
106,906 people |
0.9%
2,932,248 people |
| Native Hawaiian or Pacific Islander | 0.1%
5 people |
0.0%
8,766 people |
0.2%
540,013 people |
Herkimer Population by Gender
Herkimer, NY population information, segmented by gender, is displayed in the table below. 47.0% of the residents are males. 53.0% of the city's residents are women.
| Gender | City | State | USA |
|---|---|---|---|
| Female | 53.0%
4,105 people |
51.6%
10,000,955 people |
50.8%
156,964,212 people |
| Male | 47.0%
3,638 people |
48.4%
9,377,147 people |
49.2%
151,781,326 people |
Herkimer Population by Age
The following table displays Herkimer, NY population information, broken down by age. The city's total population is 7,743. The largest age group was aged < 25.
| Age | City | State | USA |
|---|---|---|---|
| < 25 | 36.6%
2,833 people |
32.6%
6,308,446 people |
34.0%
104,853,555 people |
| 25 - 44 | 24.1%
1,864 people |
31.1%
6,018,594 people |
30.3%
93,634,060 people |
| 45 - 64 | 22.4%
1,738 people |
26.7%
5,182,359 people |
26.4%
81,489,445 people |
| > 64 | 19.9%
1,537 people |
13.5%
2,617,943 people |
13.0%
40,267,984 people |
Herkimer Unemployment
Herkimer, NY unemployment information can be viewed in the table below. The unemployment rate city wide is 3.5%. This is lower than the national average 7.9%.
| Unemployment | City | State | USA |
|---|---|---|---|
| Unemployment Rate | 3.5%
|
7.5%
|
7.9%
National Average |
| White | 3.6%
|
6.2%
|
6.8%
National Average |
| Hispanic | 0.0%
|
10.0%
|
9.6%
National Average |
| American Indian and Alaska Native | 0.0%
|
13.0%
|
13.9%
National Average |
| Asian | N/A
|
7.0%
|
6.4%
National Average |
| Native Hawaiian or Pacific Islander | N/A
|
8.3%
|
10.5%
National Average |
| Two or more races | N/A
|
12.0%
|
12.2%
National Average |
| Black or African American | N/A
|
11.9%
|
14.0%
National Average |
Herkimer Median Income by Race
The table below displays median income by race. American Indian and Alaska Native people make $67,692 on average, this is the highest paid group.
| Race | City | State | USA |
|---|---|---|---|
| American Indian and Alaska Native | $67,692
|
$23,243
|
$21,510
National Average |
| White | $18,899
|
$35,713
|
$31,133
National Average |
| Black or African American | $10,469
|
$30,519
|
$25,062
National Average |
| Hispanic | $8,409
|
$23,374
|
$21,505
National Average |
| Asian | $0
|
$31,629
|
$34,418
National Average |
| Native Hawaiian or Pacific Islander | $0
|
$29,681
|
$26,563
National Average |
| Two or more races | $0
|
$25,628
|
$22,664
National Average |
Herkimer Median Household Income by Age
The median income, by age, is shown in the table below. The age range that has the highest income in Herkimer, NY is < 25.
| Age | City | State | USA |
|---|---|---|---|
| < 25 | $13,267
|
$27,948
|
$26,465
National Average |
| 25 - 44 | $33,245
|
$62,225
|
$57,132
National Average |
| 45 - 64 | $42,750
|
$67,186
|
$63,398
National Average |
| > 64 | $21,131
|
$33,860
|
$33,906
National Average |
Herkimer Median Worker Income
Herkimer, NY individual median income data can be seen in the table below. The city's median individual worker income is $18,349. This is lower than the national average $29,701.
| Worker Type | City | State | USA |
|---|---|---|---|
| Male | $25,412
|
$38,025
|
$35,201
National Average |
| Female | $15,850
|
$28,225
|
$24,139
National Average |
| Median Household Income | $25,778
|
$55,603
|
$51,914
National Average |
Herkimer Household Income Other than Earnings
The table below contains the data for Herkimer, NY household income, other than earnings. At $12,909, Social Security Income income is the highest category for other earnings.
| Income Type | City | State | USA |
|---|---|---|---|
| Social Security Income | $12,909
|
$15,912
|
$15,495
National Average |
| Retirement Income | $11,011
|
$22,773
|
$21,489
National Average |
| Interest, Dividends, or Net Rental Income | $5,689
|
$16,535
|
$15,308
National Average |
| Public Assistance Income | $1,588
|
$3,727
|
$3,553
National Average |
Top Herkimer Occupations
The following table lists the most popular occupations for Herkimer, NY. The largest occupations are listed first.
| Occupation | City | State | USA |
|---|---|---|---|
| Sales and office occupations | 27.1% |
25.2% |
25.4%
National Average |
| Service occupations | 26.2% |
19.1% |
17.1%
National Average |
| Production, transportation, and material moving occupations | 14.5% |
9.9% |
12.4%
National Average |
| Education, legal, community service, arts, and media occupations | 12.7% |
13.8% |
10.6%
National Average |
| Management, business, and financial occupations | 6.8% |
14.2% |
14.3%
National Average |
| Healthcare practitioners and technical occupations | 6.2% |
5.6% |
5.2%
National Average |
| Natural resources, construction, and maintenance occupations | 5.3% |
7.8% |
9.8%
National Average |
| Computer, engineering, and science occupations | 1.1% |
4.4% |
5.2%
National Average |
Herkimer Housing Overview
The Herkimer, NY median owner costs are below the state average. The median construction year for homes in Herkimer, NY is 1939. Homes have on average 6 rooms in Herkimer, NY.
| City | State | USA | |
|---|---|---|---|
| Median Owner Costs | $912
Low |
$1,958
Very High |
$1,524
National Median |
| Median Rent | $459
Very Low |
$858
Very High |
$699
National Median |
| Median Built Year | 1939
|
1954
|
1975
|
| Median Rooms | 6
|
5
|
6
|
Herkimer Housing Occupancy
Below is a table displaying housing occupancy numbers for Herkimer, NY. The percentage of owner occupied homes is above the national average. The percentage of homes being rented is below the national average.
| Type | City | State | USA |
|---|---|---|---|
| Owner Occupied | 43.9%
1,509 Homes |
49.4%
3,977,188 Homes |
58.5%
76,089,650 Homes |
| Renter Occupied | 48.5%
1,668 Homes |
40.1%
3,228,552 Homes |
29.3%
38,146,346 Homes |
| For Rent | 5.4%
186 Homes |
2.0%
162,164 Homes |
2.5%
3,286,932 Homes |
| For Sale | 0.3%
10 Homes |
0.9%
71,113 Homes |
1.5%
1,886,522 Homes |
| For Seasonal, Recreational, or Occasional Use | 0.0%
0 Homes |
3.4%
275,394 Homes |
3.6%
4,683,380 Homes |
| Total Occupied | 92.4%
3,177 Homes |
89.5%
7,205,740 Homes |
87.8%
114,235,996 Homes |
| Total Vacant | 7.6%
262 Homes |
10.5%
845,095 Homes |
12.2%
15,802,084 Homes |
| Total Housing | 3,439 |
8,050,835 |
130,038,080 |
Herkimer Mortgage Status
Use the table below to research the average mortgage status in Herkimer, NY. Here 21.5% of homes do not have a mortgage. This is below the national average.
| Type | City | State | USA |
|---|---|---|---|
| Has a Mortgage | 21.5%
739 Homes |
32.3%
2,597,200 Homes |
39.8%
51,696,841 Homes |
| No Mortgage | 22.4%
770 Homes |
17.1%
1,379,988 Homes |
18.8%
24,392,809 Homes |
Herkimer Monthly Owner Costs for Housing Homes with a Mortgage
The table below shows the average monthly expenses for home owners with a mortgage in Herkimer, NY. The average monthly cost to owners is $912.
| Monthly Mortgage | City | State | USA |
|---|---|---|---|
| < $500 | 2.6%
19 Homes |
1.3%
33,699 Homes |
2.1%
1,067,631 Homes |
| $500 - $999 | 53.7%
397 Homes |
13.3%
345,235 Homes |
19.8%
10,235,704 Homes |
| $1,000 - $1,499 | 30.7%
227 Homes |
20.3%
525,940 Homes |
27.1%
13,998,238 Homes |
| $1,500 - $1,999 | 7.6%
56 Homes |
16.5%
427,444 Homes |
19.9%
10,309,611 Homes |
| $2,000 - $2,999 | 5.4%
40 Homes |
24.5%
637,240 Homes |
19.4%
10,022,149 Homes |
| > $3,000 | 0.0%
0 Homes |
24.2%
627,642 Homes |
11.7%
6,063,508 Homes |
Herkimer Rental Prices
The below table display home rental prices for Herkimer, NY. Renters pay an average of $459 monthly.
| Monthly Rent | City | State | USA |
|---|---|---|---|
| < $300 | 19.8%
331 Homes |
8.1%
262,246 Homes |
9.0%
3,437,912 Homes |
| $300 - $499 | 33.6%
561 Homes |
11.3%
365,363 Homes |
16.3%
6,217,643 Homes |
| $500 - $699 | 28.7%
478 Homes |
16.2%
523,472 Homes |
21.9%
8,360,532 Homes |
| $700 - $999 | 7.9%
132 Homes |
23.3%
752,702 Homes |
24.0%
9,150,071 Homes |
| $1,000- $1,499 | 6.3%
105 Homes |
22.2%
717,188 Homes |
15.3%
5,825,969 Homes |
| $1,500 - $1,999 | 0.0%
0 Homes |
8.8%
285,230 Homes |
5.0%
1,898,263 Homes |
| > $2,000 | 0.0%
0 Homes |
6.4%
206,548 Homes |
2.8%
1,078,925 Homes |
- City rating based on comparing Herkimer to other New York cities.
- State rating based on comparing New York to other U.S. states.
- All ratings are segmented into quintiles (very low, low, average, high, very high).
- Data provided by the 2010 U.S. Census.